The 5 Best Business Intelligence Dashboard Software in 2022
Business intelligence dashboard software – a must-have or a nice add-on to your software arsenal? Should you invest in this kind of tool? Most of the sales and marketing software provides reports, so why not rely on existing tools to get an in-depth understanding of your business?
While it's true that most software provides reports, it's nothing but rows and columns of numbers. Raw data may give you an idea of where your business stands, but it doesn't give you an analysis.
If you are to stay ahead of your competitors and provide for ever-evolving consumer needs and tastes, you need a tool to analyze the data you collate from various tools. That is what BI software is all about.

Table of Contents
What is a BI Dashboard?
A business intelligence dashboard – or BI dashboard – is an information and data management tool. It brings together all the key performance indicators on a single dashboard to highlight performance and provide actionable insights.
If you have the right BI dashboard software it will show you a combination of graphs, charts and texts that show an assessment of your business.
BI tools don't tell you what you ought to do next; by allowing you to access the data that lies beneath the charts and graphs, they allow you to visualize data that may otherwise be too complicated to digest at a glance. This way, you can make decisions that are backed by reliable data and information from your business.
Why BI Dashboards? (Dashboards vs. Reports)
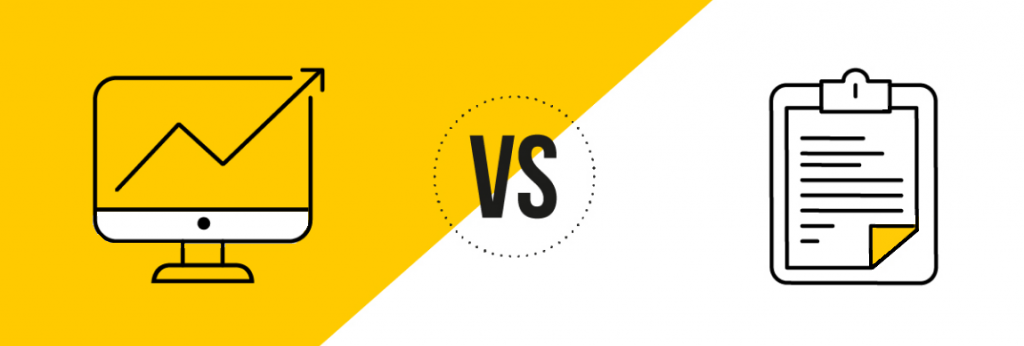
One of the first questions that people ask when it comes to business dashboard software is, “Why a dashboard? Won't a report do the same thing?”
Reports and dashboards are commonly assumed to be the same thing, but they are not.
One of the main differences is that dashboards provide analysis, while reports offer intelligence.
Intelligence is all about what is happening now and how we got here. If you are looking at a sales report, for example, you can see what your sales are for the day, week or month, and you can see the trend that has led to that point.
Business dashboards are analytical and predictive. They use the data gathered in reports to tell you what is happening now, what could happen in the future and what you can do today to provide for better outcomes in the future.
Understanding the difference between reports and dashboards is essential. It helps you decide which one you need. If all you need to see are numbers that tell you the current state of your business, reports will suffice.
However, if you want to have insights that inform decisions that allow for better outcomes as your business grows, business dashboards are the answer
There are other critical differences between reports and dashboards:
- Reports tend to be data-centric. They give you the data, and you can derive your conclusions from it. Dashboards, on the other hand, are summarized. They analyze the data and give you relatively straight and accurate conclusions.
- Reports utilize tables to present data, while dashboards use graphs and charts to predict trends.
- Dashboards present KPIs while reports give you the data behind the KPIs.
- Reports sometimes require someone with technical expertise to analyze and understand them, while BI can be understood by the non-technical mind.
Why Use a BI Dashboard?
This is an excellent question, especially when you consider that BI dashboard software costs money. There are several reasons why this kind of tool is essential for any business that hopes to grow and compete:
- It helps you monitor your business's performance.
- It highlights key areas (KPIs) that you can action right away to improve future results.
- This software is excellent for helping you identify opportunities.
- You get to understand the story behind the data, which gives you better insights into your prospects.
- You make better decisions in the long term, which makes for a more profitable business.
- BIs provide increased efficiency and 100% accuracy with business dashboards.
- Team collaboration is easier with BIs – no one has to crunch data for themselves, and each team member works off the same analytical blueprint.
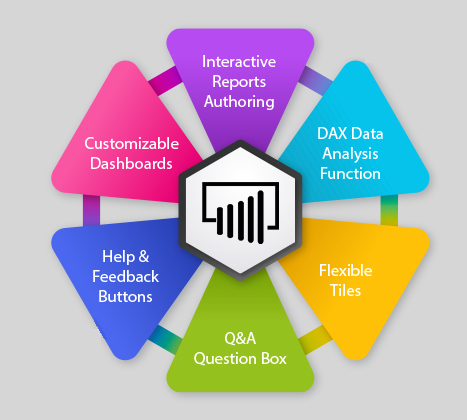
Features of BI Dashboards – What to Look For
As you look around for small business dashboard software, it quickly becomes clear that many companies offer this kind of tool.
They are not all created equal, and you need to be clear on the essential features of business dashboards if you are to choose the right one.
- They have a customizable interface – you should be able to choose different fields to display whatever analytics you need.
- The best dashboards are interactive, and users can filter data to see different future scenarios.
- A useful BI tool allows users to include real-time data.
- The best tools have standard templates that can be used and understood across teams and organizations.
- A good BI tool can be shared as this allows teams to collaborate and input data from different parts of the business.
The Best Business Intelligence Dashboard Software
Now that you know what a business dashboard is, why you should use one, and the most important features of intelligence software, let's look at the best BI software available in the market today.
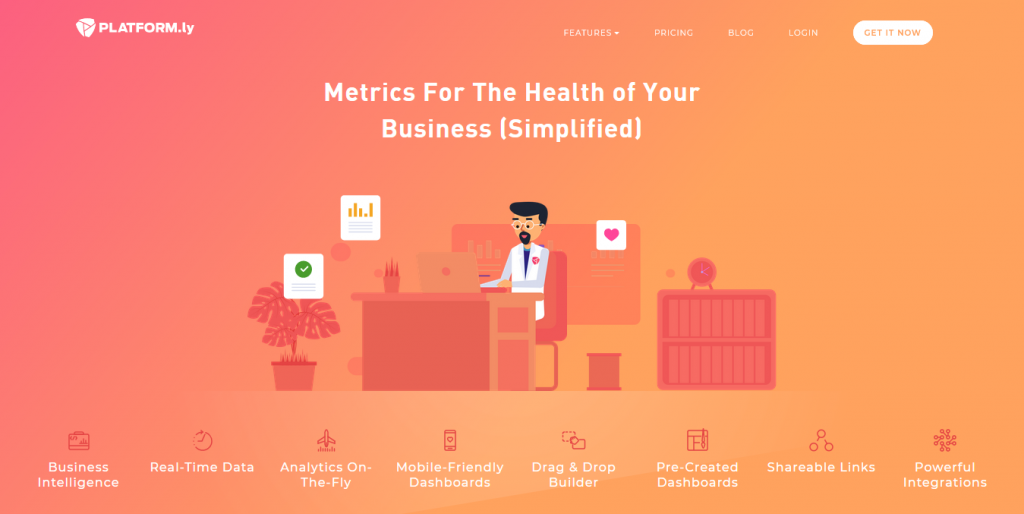
Platformly
Platformly is an end-to-end business solution that brings together everything you need for effective sales, marketing and customer relationship management. It has an excellent I dashboard that shows you simplified metrics about your business performance.
Platformly is all about automating the marketing process to hasten business growth. It helps you understand different aspects of your business and provides insights that you can implement right away to improve customer acquisition and accelerate business growth.
By analyzing data and showing you how it all ties together, you understand what drives your business and what you can do differently for better results in the future.
Features
- It provides clear and actionable BI that you can implement right away. You get reports on all aspects – customers, customer acquisition, CRM, lead capture, link tracking and more. All these are analyzed for you to have a good overview of where things stand and what you can do going forward.
- You get data on the fly. You can see what is happening in your business at this very moment. Why is this important? Because many tools tend to use historical data, and they don't provide an accurate picture of the current state of affairs.
- The software is available online and accessible through all the usual devices. You can check on your business wherever you are, whenever you like. You don't need to access it through a computer or laptop as it has mobile-friendly dashboards.
- Do the analytics tell you that you need a new lead-capture form, or a brand new email sequence? The software has an easy drag-and-drop feature that you can use to create both in a matter of minutes.
- Use Platformly to build an interactive dashboard that is customized to your business. It has an array of widgets and integrations that allow the business user to display the analytics you need for your business.
- If you don't have time to create your own dashboards, the software comes with pre-built dashboards that you can implement right away.
- The dashboards you create are sharable across teams and among stakeholders.
- Platformly integrates with a variety of sales and marketing software.
As mentioned earlier, Platformly brings together all the tools you need for sales, marketing and CRM. To access business dashboards, you need to buy the Platformly suite.
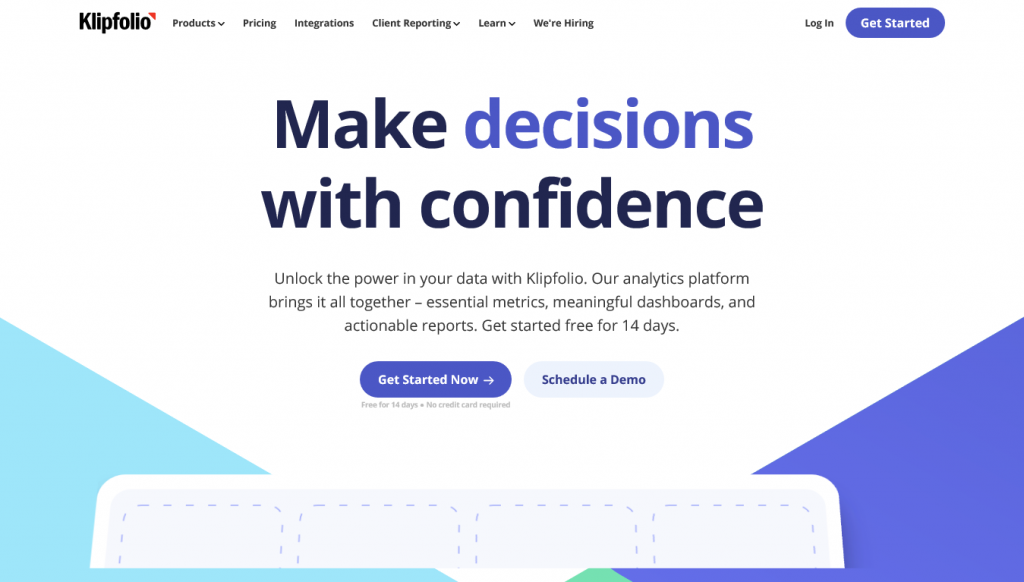
Klipfolio
Unlike Platformly which brings together sales, marketing, CRM and dashboards, Klipfolio is purely a dashboard intelligence software. This software's premise is that you don't need to accumulate endless data tables to make sense of your business.
With Klipfolio, all you need is an idea of the metrics you'd like to track and the right credentials, and you'll get in-depth analysis that you can implement for business growth.
It provides insights that help you uncover hidden opportunities to help you get ahead of the competition. Instead of spending time trying to make sense of data from different parts of your business, Klipfolio does it for you, leaving you to focus on making and implementing the right decisions for your business.
Features
- You can collect data from a vast array of sources. If there is an app that collects data from your business, connect it to Klipfolio and the data will be analyzed and integrated and presented in a form you can understand. It analyzes data from cloud storage like DropBox, Google Drive and Box, as well as Excel, CSV and XML files. You can connect the software to common databases to extract data for analysis.
- There are multiple ways you can connect your data sources to Klipfolio. You can upload files, use an FTP/SFTP connector, an SQL connector and more.
- You can refresh data as often as you like, making this software ideal to showcase data on TV screens and wallboards.
- Use Klipfolio to build customized reports that you can share through email, PDF and popular collaboration tools like Slack.
- Keep an eye on your KPIs to see where your business is at, and what you need to do to take it to the next level.
- The software provides easy visualizations that can be understood by all, including graphs and diffrent chart types. You can compare different periods using filters and trend lines.
- You can build a custom dashboard using the drag and drop feature.
- If you would like a more in-depth analysis of your data the software provides sophisticated formulas that help you drill even further down to give you an even clearer understanding of your data.
Scoro
Scoro compares with Platformly because it brings together various functionalities to provide a full sales and marketing tool. It combines CRM, billing, reporting project management and business dashboard reporting under one platform.
The Scoro dashboard allows you to monitor each project in your pipeline. You can see action items, conversions, deadlines, various tasks and their status and progress as it happens.
It also analyzes data from every aspect of your business, giving you insights and allowing you to implement decisions that improve sales and customer acquisition.
Features
- It has an easy interface – you don't have to be technical to use this software, and can be implemented within different teams.
- You can see dynamic results on all different aspects including project management, CRM, sales, marketing and more.
- Scoro eliminates double data entry. Enter data once and it can be viewed by anyone who has the right permissions. Different team members can analyze the data to extract whatever insights they need.
- Connect with thousands of apps through Zapier to ensure you have all the data you need for accurate and up-to-date analysis.
- You can get a complete overview of each customer on one screen. See their history, products, invoices and orders, and insights into how you can get more out of them.
- Scoro supports various languages including Russian, Lithuanian and Estonian.
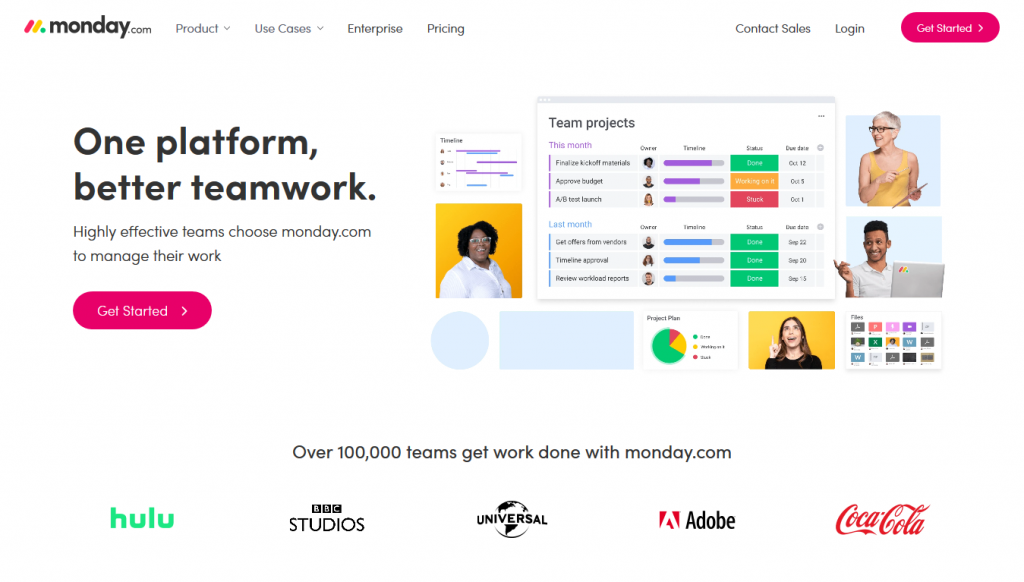
Monday.com
The premise of Monday is quite simple – display what's important in one place. It comes with 15 widgets that users can use to customize dashboards and keep everyone focused on the same goals.
What makes Monday unique is that it packs a lot of functionality but remains one of the easiest business dashboard tools in the market. It has an appealing interface that's easy to learn, and it can be used across the business by anyone who needs performance insights.
Features
- You can add and create dashboards as desired. Choose the type of dashboard you want and select what data fields you would like analyzed within each board. You can choose who can see your dashboard and export it to other team members.
- To keep the team in the loop, create dashboards and schedule them to email automatically.
- This BI software shows you how workload is distributed amongst team members. If some have too much to do you can redistribute tasks for optimal future results.
- Analysis is presented in charts and graphs that are easy to read and interpret.
- If you'd rather track numbers, a numbers widget allows you to see chosen fields at a glance. You can set it up to show you revenue, costs, number of leads, number of deals in the pipeline, how many have been closed and more.
- You can integrate a variety of apps to gather data from across the business.
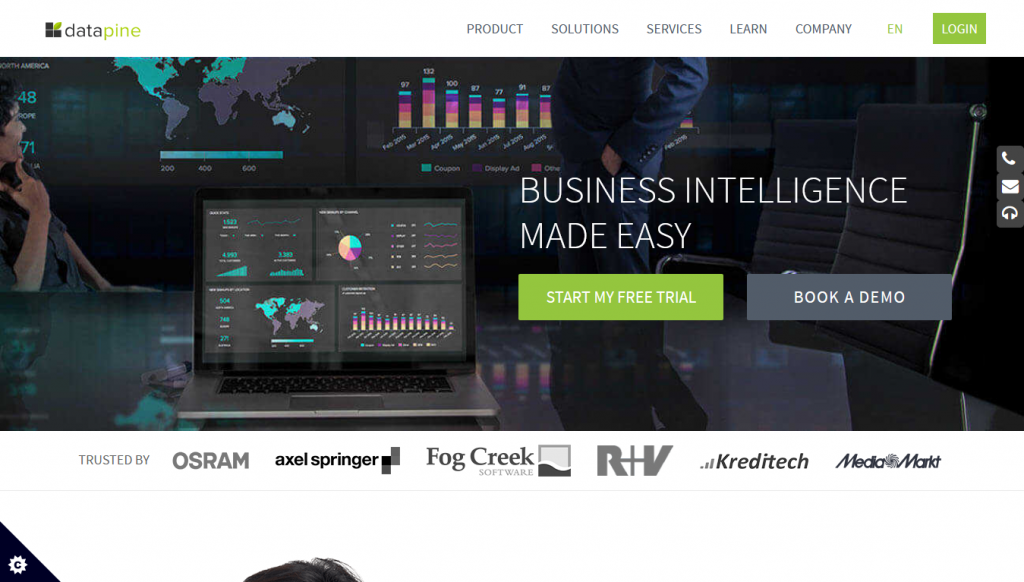
Datapine
Datapine combines data visualization and business intelligence to help you understand your data and discover actionable insights that lead you to your goals fast and efficiently.
It provides scalable, customizable and actionable data analysis that you can use to get ahead of your competition.
Because the software integrates with a wide variety of apps you're able to collect data from every section of your business and bring it all under one platform for in-depth and insightful analysis.
Features
- The dashboards are grouped in such a way that finding the right one for your business is easy. You can see dashboards by function, by industry and by platform.
- A drag-and-drop user interface allows you to create dashboards that you need on the fly.
- You get a variety of data visualizations, including graphs and charts. They are well-designed and easy to understand for easy decision making.
- You can drill into your data for more complex analysis using advanced formulas provided within the software.
- A set of powerful filters allow you to customize dashboards for different teams within the business.
- You can share reports within the team and among stakeholders.
- The software is optimized for mobile, giving you analytics and insights on the move.
Conclusion
Business intelligence dashboard software is necessary to propel your business to the top of your niche and stay there. It allows you to see not just the inside mechanics of your business as the bigger picture – what you should be doing to increase sales and revenue.
Not all intelligence software is built the same. The best is the kind that provides in-depth analysis, has an easy learning curve and user interface, is customizable and collects data from a wide variety of sources. It should also be sharable so that team members and stakeholders can read off the same blueprint.
All the BI software discussed here meets these criteria. However, if we had to choose one, it would be Platformly.
Its BI dashboards provide real-time insights and in-depth analytics that you can implement right away. It has an excellent user interface, and it doesn't take long to learn and understand. You can use it to build customized dashboards, and they are sharable.
Not only does Platformly offer first-class intelligence dashboards, but it also brings together a combination of sales, marketing and CRM tools that will take your business to the next level.